

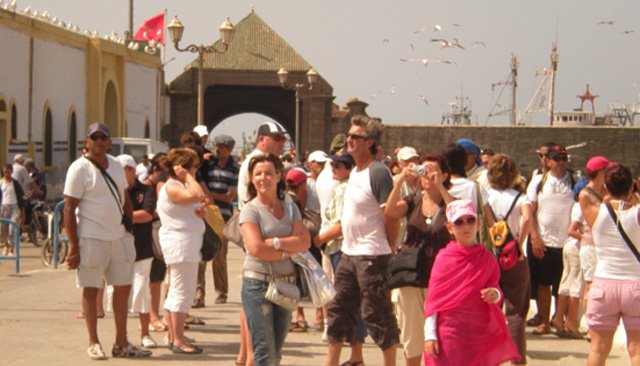
The first 4 countries in the Top 10 for arrivals and receipts remain, at different ranks, France, China, the United States and Spain
In 2015, tourism recorded, for the 6th consecutive year, an increase in international arrivals.
Tourist arrivals are constantly increasing, from 25 million in 1950 to 278 million in 1980, 674 million in 2000 to 1 billion 186 million in 2015.
This increase is due to good figures recorded in North America, Asia and the Pacific (+6%) and Europe (+5%). Revenues increased from US$ 2 billion in 1950 to 104 billion in 1980, 495 billion in 2000 to 1,260 billion in 2015.
KEY FIGURES OF WORLD TOURISM
10% of GDP
1 in 11 jobs
7% of world exports
30% of service sector exports
1 billion 186 million international tourist arrivals (+4.6%)
1,260 billion US$ in export revenue (+4.4%)
The share of tourism in the overall export budget increased from 6% to 7%, representing 30% of exports from the services sector and recorded a significant increase for the 4th consecutive year. Tourism ranks third in the world behind the fuel and chemical sectors and ahead of the food industry and automobiles.
HIGHLIGHTS OF WORLD TOURISM IN 2015
1 billion 186 million tourists traveled across the planet, corresponding to 52 million additional tourists, an increase of 5%.
International tourism (including travel spending and passenger transport) represents a global amount of US$1.5 trillion, or US$4 billion on average per day.
China, the United States and the United Kingdom are the leading emitting countries in their respective regions.
The Chinese market continues to grow: +10% additional tourists with 128 million tourists who spent 292 billion.
The first 4 countries in the Top 10 for arrivals and receipts remain, at different ranks, France, China, the United States and Spain. Thailand received 20% more tourists and moved up to 6th position in the TOP 10 revenues by country.
Europe remains the continent receiving the largest number of tourists (51%) and recorded an increase of 5%. International tourist arrivals increased by 6% in the Americas, Asia and the Pacific.
LEADING WORLD DESTINATIONS
Europe remains the most visited continent (51%), followed by Asia and the Pacific (24%), the Americas (17%), the Middle East (3%), and Africa (3%). France, the United States, Spain and China occupy the first 4 places in the TOP 10. The United States is the leader in terms of revenue with US$ 205 billion, and the second with 78 million international arrivals.
China, in 2nd position, accounts for US$114 billion in revenue and 57 million arrivals (4th).
Spain, with 57 billion US$ and 68.2 million arrivals, comes in 3rd position. France confirms its first position with 83.7 million arrivals, and ranks 4th in terms of receipts
with 45.9 billion US$.
The United Kingdom remains in 5th place in receipts and 8th in arrivals. Thailand climbs to 6th place in receipts and 11th in arrivals. Italy consolidates its 5th position in arrivals and falls from 6th to 7th place in receipts. Germany moves to 8th position in terms of revenue and confirms its 7th position in terms of arrivals. Turkey maintains its position of 6th in arrivals and 12th in receipts.
Mexico goes back to 9th place in arrivals, and 16th place in receipts. The Russian Federation is in 10th place (9th in 2014) in terms of arrivals and loses 5 places in receipts (34th position).
Hong Kong (China) in 9th position and Macau (China) in 10th position, complete the TOP 10 in the ranking in terms of revenue.
Leading countries in terms of international tourism spending: China consolidates its first position among the countries whose nationals spend the most when they travel. This financial windfall benefits Asian countries, mainly Japan and Thailand, but also the United States and certain countries
European countries, including Germany, the United Kingdom and France.
128 million Chinese traveled in 2015 (+10%) and spent US$292 billion (+26%).
The 73 million U.S. nationals spent 113 billion US$. The British boosted European tourism with 64 million tourists (+5 million) and spent US$63 billion. Germany, although in decline, with US$ 78 billion retains its third position. France (38.4 billion US$), in
regression also, goes up one place. The Russian Federation (US$35 billion) fell one place despite an increase in spending of 10%. Canada consolidates its 7th place with US$29 billion in spending.
The Republic of Korea (US$25 billion) made a spectacular jump of six places and found itself in 8th position.
THE FUTURE OF TOURISM BY 2030
The main data presented in “TourismTowards” correspond to projections studied for the period 2010/2030.
This document was produced by analyzing various social, political, economic, environmental and technological data which have impacted tourism in recent years and which are expected to influence the sector in the future.
In accordance with this report, the number of international tourist arrivals is expected to increase by an average of 3.3% per year for the period covering 2010 to 2030. The increase is expected to decrease, from 3.8% in the first period, to 2.9% at the dawn of 2030. In absolute figures, the number of tourists is expected to increase by 43 million per year, compared to the average of 28 million/year for the period 1995 to 2030. 2010.
The number of international tourist arrivals is expected to reach 1.4 trillion in 2020 and 1.8 trillion
in 2030.
International tourist arrivals to emerging economy countries in Asia, Latin America, Eastern Europe, Central Europe, Southern and Mediterranean Europe, the Middle East and Africa will grow faster
(+4.4%/year) than those of destinations in advanced economies (+2.2%/year).
As a result, before 2020, the number of arrivals in countries with emerging economies is expected to be higher than those in countries with advanced economies.
In 2030, 57% of international arrivals will be in destinations with emerging economies. (versus 30% in 1980) and 43% in countries with advanced economies (versus 70% in 1980).
Asia and the Pacific will see the largest increase. Arrivals will reach 535 million, an annual increase of 4.9%. The Middle East and Africa will see their number of arrivals increase, from 61 million to 149 million for the Middle East, and from 50 million to 134 million for Africa. Europe, going from 475 million to 744 million and the Americas from 150 million to 248 million, will see slower progression.
The map of market shares will therefore be completely modified: Asia/Pacific representing 30% in 2030 (22% in 2010); the Middle East representing 8% (6% in 2010); Africa 7% (5% in 2010); Europe 41% (51% in 2010); the Americas 14% (16% in 2010).
Source: Press Kit Iftm 2016